Independent economic studies for the governments, developers, and businesses of the Mountain Home area, built on Elmore County's own federal data and designed to hold up when a lender or a funder reviews them.
| Largest sectors by employment | Jobs | Concentration |
|---|---|---|
| Retail trade | 947 | 1.25x |
| Health care & social assistance | 923 | 0.81x |
| Public administration | 892 | 2.41x |
| Accommodation & food services | 793 | 1.16x |
| Manufacturing | 776 | 1.23x |
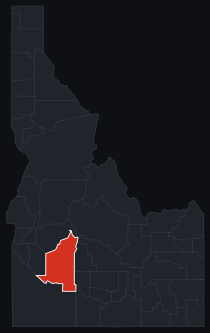
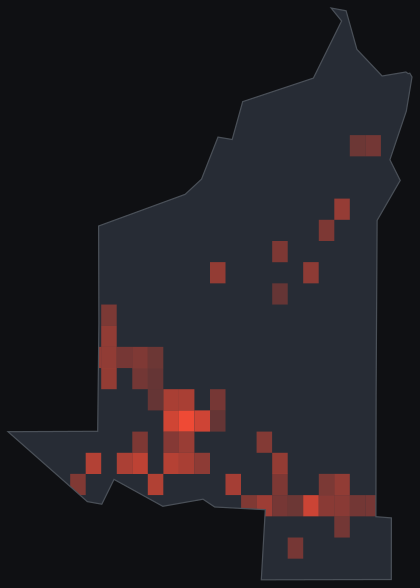
Source: U.S. Bureau of Labor Statistics, Quarterly Census of Employment and Wages, 2023 annual averages, Elmore County. Concentration is a location quotient (county sector share of employment divided by the national share), computed by Project Red Team. Covered jobs exclude the self-employed and some agricultural workers.
Elmore County runs on roughly 7,500 covered jobs across about 730 establishments, at an average annual wage near $45,100. Retail, health care, and public administration lead the headcount, and the shape of the economy reflects two forces at once. Public administration runs at about 2.4 times the national rate, the footprint of Mountain Home Air Force Base and the federal and local government around it, while agriculture, forestry, and fishing employ people at close to ten times the national rate out on the surrounding ranchland and irrigated ground. A small county carries an unusually large base and an unusually concentrated farm economy side by side.
Elmore County's economy stands on two legs. Mountain Home Air Force Base is the anchor, the county's largest employer and the reason public administration is so heavily concentrated here, supporting thousands of military and civilian jobs and a steady stream of off-base spending. The other leg is agriculture: cattle ranching and irrigated farming across the high desert and the Snake River ground to the south. Retail, health care, and hospitality in Mountain Home serve the base, the ranch country, and the interstate traffic between Boise and the Magic Valley.
A base-related contract or housing project, a utility-scale solar array on the open high desert, a ranch or feedlot expansion, or a new retail anchor in Mountain Home all turn on the same two questions: what the project genuinely returns to the county, and whether it pencils under Elmore County's real land, labor, and market conditions.
The two live subjects a study here has to reckon with are the economic weight of Mountain Home Air Force Base, whose payroll, contracts, and household spending account for a large share of the county's economy, and the utility-scale solar development that the region's flat high-desert land and Idaho Power interconnection have started to attract. A project like a new solar array or a base-driven expansion brings construction spending, land-lease and payroll income, and long-run tax effects, and the county will want those measured honestly, separating durable activity from one-time construction and separating genuinely new demand from spending that would have occurred anyway. That is exactly the kind of question the engine is built to answer.
Public-data path: regional input-output multipliers, free-data regionalized or drawn from a purchased BEA RIMS II order where a project supplies one, BLS QCEW and Census LODES for the local labor base, USDA NASS for the ranch and irrigated-farm economy, and published Department of Defense economic-impact figures for the base where a study needs the installation's footprint.
We produce the study first: economic impact (what a project brings to Elmore County, in jobs, output, and tax revenue, with local leakage handled honestly), feasibility and viability (whether it should move forward, measured with the finance a lender runs), and fiscal impact for public budgets and grant applications. Every engagement returns a full report, a one-page brief, a reviewer pack, and a decision package.
And if a study is already in hand, we review it: we inventory its quotable claims, attach the evidence, and tell you plainly what survives review before you quote it or fund against it. More on reading a study before you rely on it.
National firms fly in, bill the travel, and price a county like Elmore out of the analysis it needs. We work across the interior West, we can be on-site, and we build every study on the county's measured federal record, the same BLS and Census data behind the numbers above, so the result traces to a public source and survives scrutiny.
Have a project in Elmore County? Tell us what you are weighing and where. We will lay out what it takes to answer it, and what it costs.
Commission a study