Independent economic studies for the governments, developers, and businesses of the Mason Valley and the Interstate 80 corridor, built on Lyon County's own federal data and designed to hold up when a lender or a funder reviews them.
| Largest sectors by employment | Jobs | Concentration |
|---|---|---|
| Manufacturing | 2,074 | 1.8x |
| Retail trade | 1,759 | 1.26x |
| Educational services | 1,242 | 1.07x |
| Construction | 1,082 | 1.49x |
| Accommodation & food services | 985 | 0.78x |
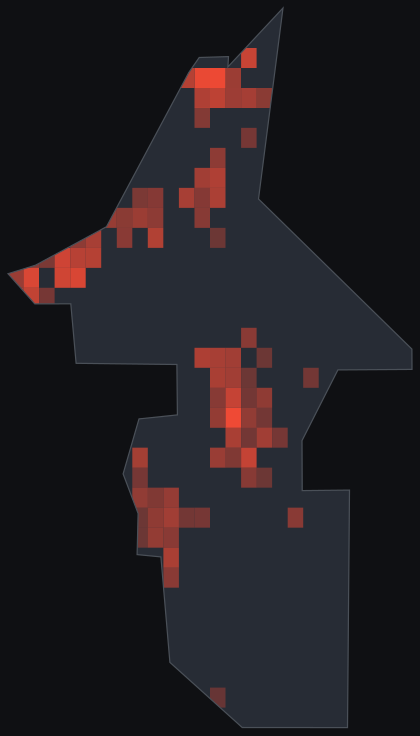
Source: U.S. Bureau of Labor Statistics, Quarterly Census of Employment and Wages, 2023 annual averages, Lyon County. Concentration is a location quotient (county sector share of employment divided by the national share), computed by Project Red Team. Covered jobs exclude the self-employed and some agricultural workers.
Lyon County runs on roughly 13,700 covered jobs across about 1,110 establishments, at an average annual wage near $55,400, with employment down about 2.5 percent over the year, a decline worth watching. Manufacturing is the largest employer, near 2,100 jobs, followed by retail, education, construction, and accommodation and food service. The county carries several strong concentrations at once: mining and extraction at nearly nine times the national rate, agriculture and ranching at more than five times, arts, entertainment, and recreation at more than two and a half times, and manufacturing at about 1.8 times. That mix reflects a county spread across the copper country near Yerington, the farms of the Mason and Smith valleys, and the industrial corridor at Fernley.
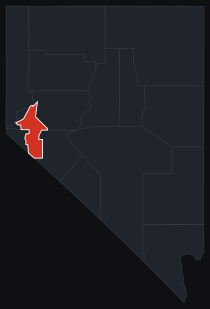
Lyon County spreads across several distinct economies. Fernley, at the eastern edge of the Reno-Sparks industrial corridor along Interstate 80, has drawn manufacturing and distribution and gives the county its manufacturing concentration. Yerington and the Mason Valley carry a long copper-mining history and a working agricultural base, and the Smith Valley adds more farms and ranches. That spread shows up in the data as strong concentrations in mining, agriculture, and recreation all at once.
A copper-mine restart, a new plant or warehouse at Fernley, a housing development, or a ranch operation all turn on the same two questions: what the project genuinely adds to the county, and whether it pencils under the real labor and land conditions of a county that touches both the industrial corridor and the farm valleys south of it.
A concrete subject here is the restart of the Pumpkin Hollow copper mine near Yerington, the county's largest underground operation. After the prior operator entered bankruptcy in 2024, Kinterra Capital acquired the site and its infrastructure and has been working toward reopening the underground mine, with copper positioned as a critical material. A restart of this size reshapes payroll, supplier demand, and county revenue, and it is the kind of project a lender or a county wants measured before it relies on the numbers, with genuinely new activity separated from activity that would have happened anyway. The distribution and manufacturing corridor along Interstate 80 at Fernley raises the same questions each time a warehouse or plant lands there.
Public-data path: regional input-output multipliers, free-data regionalized or drawn from a purchased BEA RIMS II order where a project supplies one, BLS QCEW and Census LODES for the local labor base, USDA NASS for agriculture, and the operator disclosures and county filings around the Pumpkin Hollow restart.
We produce the study first: economic impact (what a project brings to Lyon County, in jobs, output, and tax revenue, with local leakage handled honestly), feasibility and viability (whether it should move forward, measured with the finance a lender runs), and fiscal impact for public budgets and grant applications. Every engagement returns a full report, a one-page brief, a reviewer pack, and a decision package.
And if a study is already in hand, we review it: we inventory its quotable claims, attach the evidence, and tell you plainly what survives review before you quote it or fund against it. More on reading a study before you rely on it.
National firms fly in, bill the travel, and price a county like Lyon out of the analysis it needs. We work across the interior West, we can be on-site, and we build every study on the county's measured federal record, the same BLS and Census data behind the numbers above, so the result traces to a public source and survives scrutiny.
Have a project in Lyon County? Tell us what you are weighing and where. We will lay out what it takes to answer it, and what it costs.
Commission a study