Independent economic studies for the governments, developers, and businesses of Shasta County, built on the county's own federal data and designed to hold up when a lender, a council, or a funder reviews them.
| Largest sectors by employment | Jobs | Concentration |
|---|---|---|
| Health care & social assistance | 15,658 | 1.5x |
| Retail trade | 9,340 | 1.34x |
| Accommodation & food services | 5,948 | 0.94x |
| Public administration | 5,901 | 1.74x |
| Educational services | 5,804 | 1.0x |
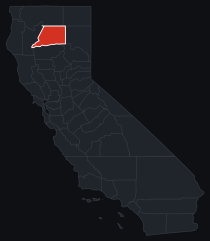
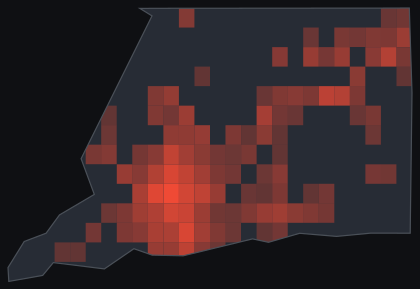
Source: U.S. Bureau of Labor Statistics, Quarterly Census of Employment and Wages, 2023 annual averages, Shasta County. Concentration is a location quotient (county sector share of employment divided by the national share), computed by Project Red Team. Covered jobs exclude the self-employed and some agricultural workers.
Shasta County runs on roughly 68,529 covered jobs across 8,088 establishments, at an average annual wage of $57,126, with job growth up a modest 1.4 percent over the year. Health care and social assistance is the largest sector by a wide margin at 15,658 jobs, followed by retail trade at 9,340, accommodation and food services at 5,948, public administration at 5,901, and educational services at 5,804. Health care and retail also carry real concentration, running 50 percent and 34 percent above the national rate. The sharpest specialization in the county, though, sits where the job counts don't show it: public administration runs at 1.74 times the national rate and utilities at 1.65 times, the fingerprint of a county built around a federal dam and reservoir system the government has run here since the 1940s.
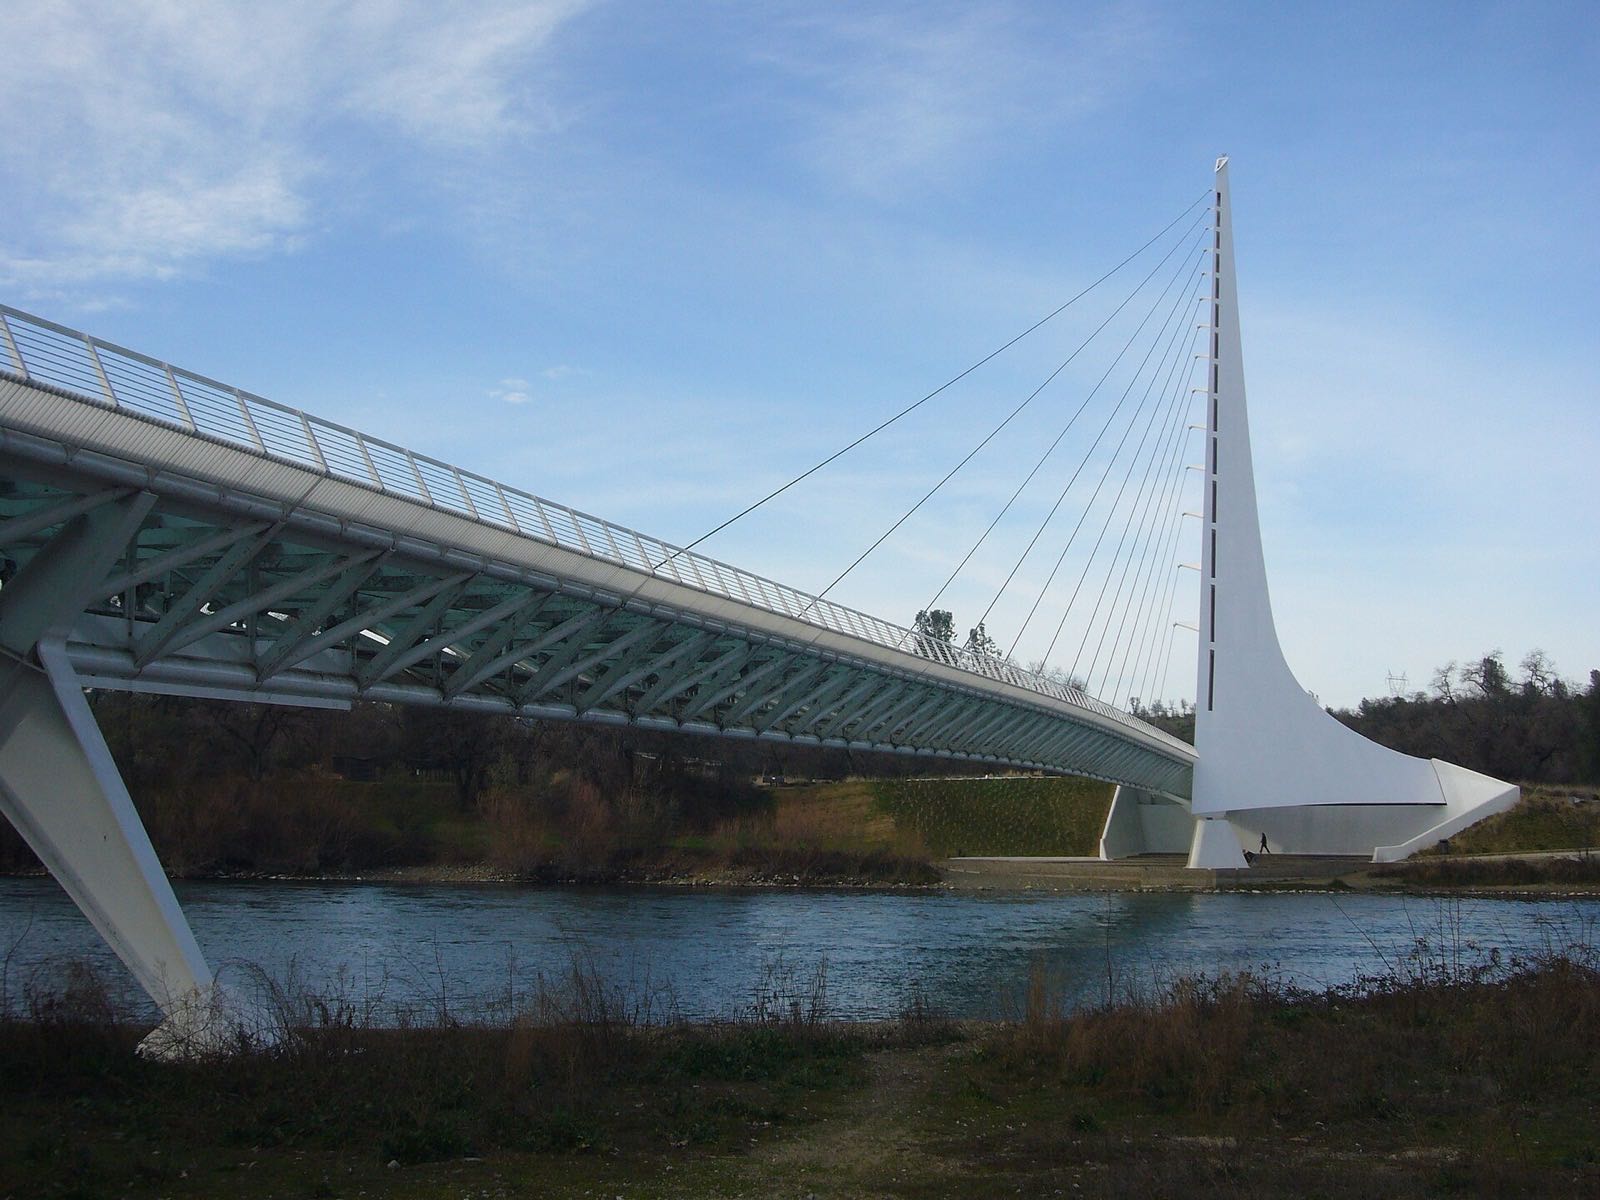
Redding is the retail, health care, and services hub for the whole North State, drawing customers and patients from Trinity, Siskiyou, Modoc, Lassen, and Tehama counties and from across the Oregon line, a role the retail and health care concentration numbers above confirm directly. Mercy Medical Center Redding and Shasta Regional Medical Center anchor that health care base. Sierra Pacific Industries, California's largest private landowner and one of the largest lumber producers in the country, runs a mill and its corporate headquarters in Anderson, keeping wood products a working part of the county's economy alongside the offices and shops. Tourism runs through Shasta Lake's houseboating and camping, the Sundial Bridge and Turtle Bay Exploration Park on the Sacramento River, and the gateway routes into Lassen Volcanic National Park, a steady draw for the county even though its job count sits close to the national average for the sector rather than standing out as a specialization.
The county's most recent chapter is the rebuild from the 2018 Carr Fire, which burned more than 229,000 acres and destroyed over a thousand homes in and around Redding, including the Land Park and Lake Redding Estates neighborhoods, a rebuild residents and the county are still finishing years later. The bigger, unresolved question sits upstream of all of it: the federal government's long-standing proposal to raise Shasta Dam by 18.5 feet, adding roughly 630,000 acre-feet of storage to the reservoir that already drives the county's outsized utilities concentration. California law bars state agencies from assisting the project because the higher pool would flood stretches of the McCloud River protected under the state's own Wild and Scenic Rivers Act, and the Winnemem Wintu Tribe has fought the raise for decades because the same water would cover village and burial sites central to the tribe's history. The project has cleared federal feasibility study more than once and has never been authorized or funded to build.
The proposal worth a hard look is the Shasta Dam and Reservoir Enlargement Project itself. The Bureau of Reclamation's own feasibility work puts the added water supply and hydropower value of the raise against a cost that has run past a billion dollars in federal estimates, and that comparison alone is where most public discussion of the project stops. An honest study has to go further: net out the construction jobs and regional spending an actual build would generate, most of it temporary, against the relocation cost of the roads, rail line, and recreation infrastructure the higher pool would require, the disruption to Shasta Lake's tourism economy during a build that would run years, and the water and power benefits weighed against who actually receives them downstream. None of that resolves the legal bar under state law or the harm to the Winnemem Wintu, but it does show a county weighing its own stake in the project what the number the federal government leads with actually contains.
Public-data path: regional input-output multipliers, free-data regionalized or drawn from a purchased BEA RIMS II order where a project supplies one, BLS QCEW for the local job and wage base, Census LODES and ACS for commuting and demographic detail, USDA NASS for the county's agricultural water use, and the Bureau of Reclamation's own published feasibility-study cost and yield figures for the Shasta Dam raise.
We produce the study first: economic impact (what a project brings to Shasta County, in jobs, output, and tax revenue, with local leakage handled honestly), feasibility and viability (whether it should move forward, measured with the finance a lender runs), and fiscal impact for public budgets and grant applications. Every engagement returns a full report, a one-page brief, a reviewer pack, and a decision package.
And if a study is already in hand, we review it: we inventory its quotable claims, attach the evidence, and tell you plainly what survives review before you quote it or fund against it. More on reading a study before you rely on it.
National firms fly in, bill the travel, and price a county like Shasta out of the analysis it needs. We work across the interior West and the North State, we can be on-site in Redding, and we build every study on the county's measured federal record, the same BLS and Census data behind the numbers above, so the result traces to a public source and survives scrutiny.
Have a project in Shasta County? Tell us what you are weighing and where. We will lay out what it takes to answer it, and what it costs.
Commission a study